Area A is the source of the contamination at Site 4. Investigations completed to date have identified trichloroethene (TCE) as the primary chemical of concern in soil and groundwater; however, high concentrations of TCE have not been detected in the soil of Area A. The TCE appears to have been released at Launch & Service Building Nos. 1, 2, and 3. The sediments underlying Area A consist of the loosely consolidated sands, clay, and gravel of the Ogallala Formation followed by the soft fine-grained sands and clay of the White River Formation. The local aquifer consists of the water-bearing zones of the White River Formation, which occur at approximately the same depth as the TCE contamination in Area A. TCE is present in the in soil vapor, soil matrix, and groundwater of these water-bearing zones.
Twenty monitoring wells have been installed in Area A. Soil-vapor and soil samples were collected and analyzed during drilling for the Remedial Investigation in 2006 (USACE) and drilling in 2008 (RMC) to identify specific source areas. TCE was detected in the soil vapor during drilling at all three Launch and Service Buildings; however, TCE was detected only in soil samples collected from the Ogallala Formation and upper reaches of the White River Formation at Launch and Service Building 3 (low concentrations only) (RMC, 2008). Low-level TCE contamination at Building 3 extends to a depth of approximately 30 to 45 feet below the Ogallala Formation-White River Formation contact and drops off sharply at depths greater than 45 feet. The contaminated zone consists of unsaturated clayey soils with TCE values ranging from non-detectable to over 100 microgram per kilogram (μg/Kg; note: both μg/Kg and μg/L are equivalent to parts per billion or ppb).
Similar TCE occurrence and distribution is likely in the unsaturated zone at Launch and Service Buildings 1 and 2; however, a different sampling technique was used in 2006, which may explain the lack of TCE detected in soil samples in these areas. TCE soil concentrations at Launch and Service Building No. 2 may be higher than those observed at Building No. 3 because the TCE concentrations in groundwater at this location are higher than those detected in wells near Building No. 3.
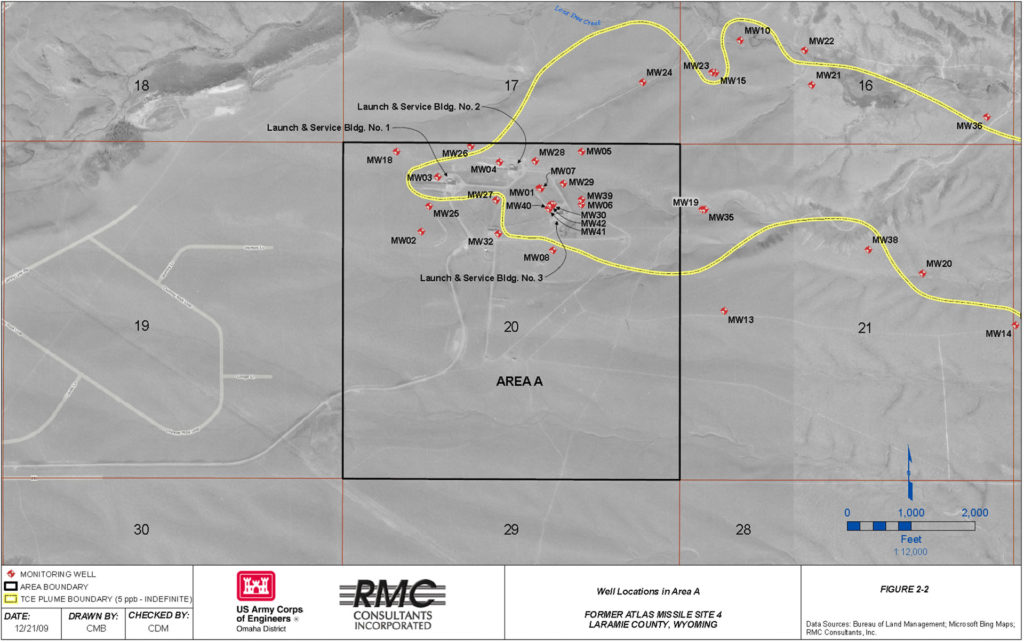
Groundwater sampling from 2007 to present has revealed TCE concentrations ranging from below the reporting limit of 1.0 micrograms per liter (μg/L) to 5,800 μg/L at monitoring well FEW-MW28. Figure 2 shows the groundwater contaminant plume that extends from Area A eastward to the Borie Well Field (Area B). The yellow outline on the figure represents 5 μg/L TCE in the groundwater, which is EPA’s drinking-water action level for TCE. The area within the yellow lines represents the TCE contaminant plume. TCE distribution in the White River Formation is consistent with transport dominated by slow advection and diffusion of TCE from the clayey soils into the water-bearing units.