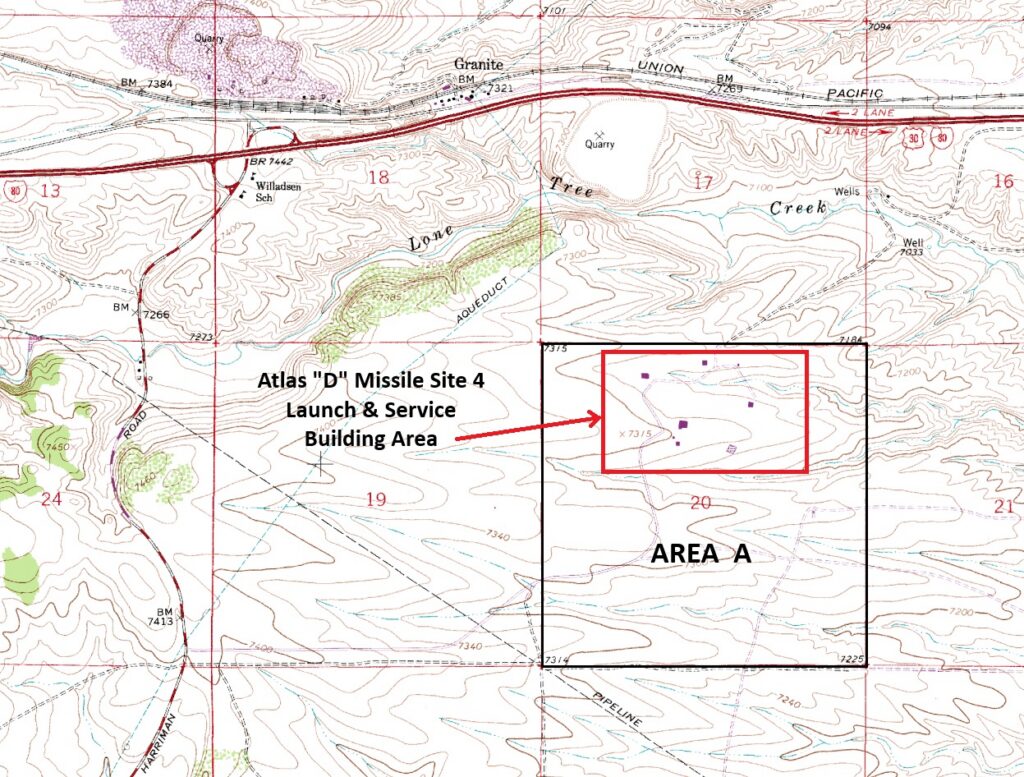
Area A has been defined as the one-square-mile Public Land Survey System (PLSS) section within which the former missile installation is located, Section 20 of Township 13 North, Range 69 West, 6th Principal Meridian. The Launch & Service Building (LSB) area occupies the northern half of Section 20, with a couple of service roads and the site entrance road present across the middle of Section 20. The southern third of Area A is vacant and shows no evidence of previous use as part of the former missile site.
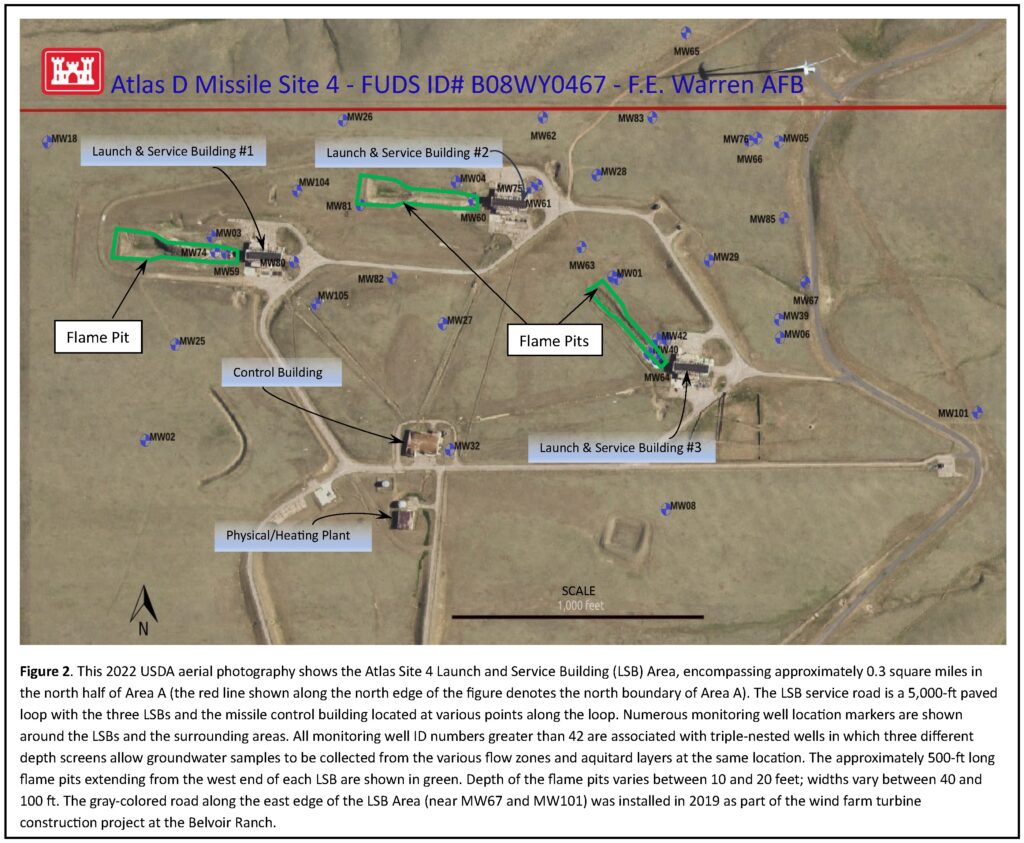
The Source Area of the trichloroethene (TCE) groundwater contamination at Atlas Site 4 is located in Area A, specifically in the subsurface below the LSB area. A site map for the Atlas Site 4 LSB Area showing key site features is provided below as Figure 2. The TCE appears to have been released at each of the three LSBs (LSB Nos. 1, 2, and 3). The sediments underlying Area A consist of the loosely consolidated silty sands, gravelly sands, and clay layers of the Ogallala Formation. Between 60 and 80 feet of surficial Ogallala material is underlain by the fine-grained silts, clays and mudstones of the White River Formation (WRF) Brule Member. The water table is present close to the contact between the two formations: the water table is about 20 feet below the contact in the western part of the LSB area (i.e., at LSB 1), and a few feet above the contact at the east end (at LSB 2), and about two feet below the contact at LSB 3.
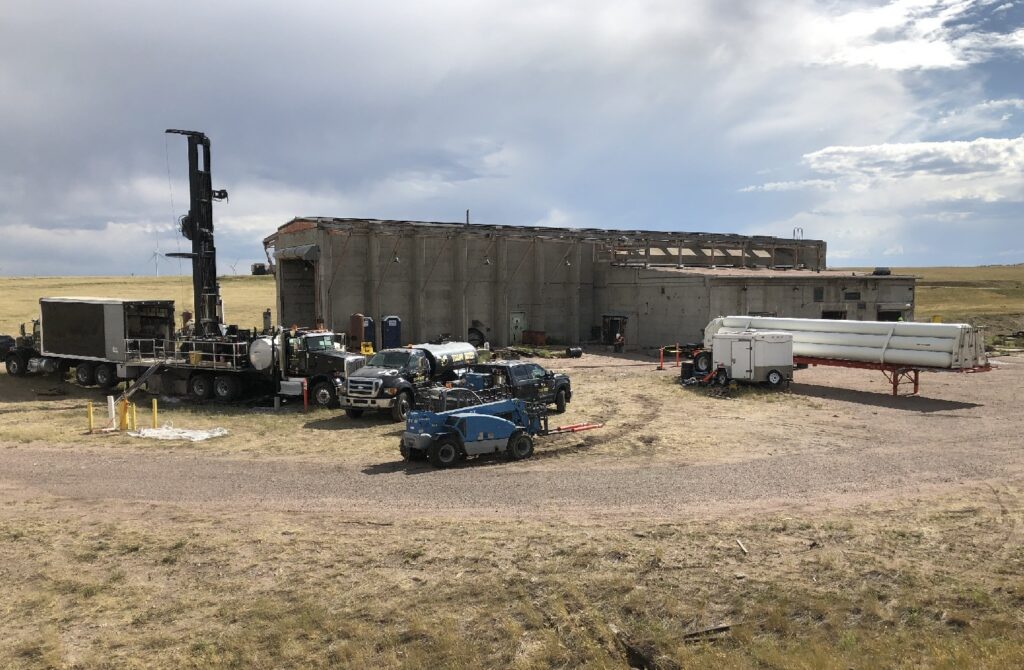
The Remedial Investigation performed 2016-2020 included installation of 17 nested monitoring wells in Area A to expand the existing network of 18 single (standalone) monitoring wells. Each nested monitoring well location includes three 2-inch diameter PVC wells installed in the same borehole (triple-nested well) at different depths within and below the zone of contamination, except for MW64 which only has two wells installed in the borehole, for a total of 50 additional groundwater sampling points installed during the RI at Area A.
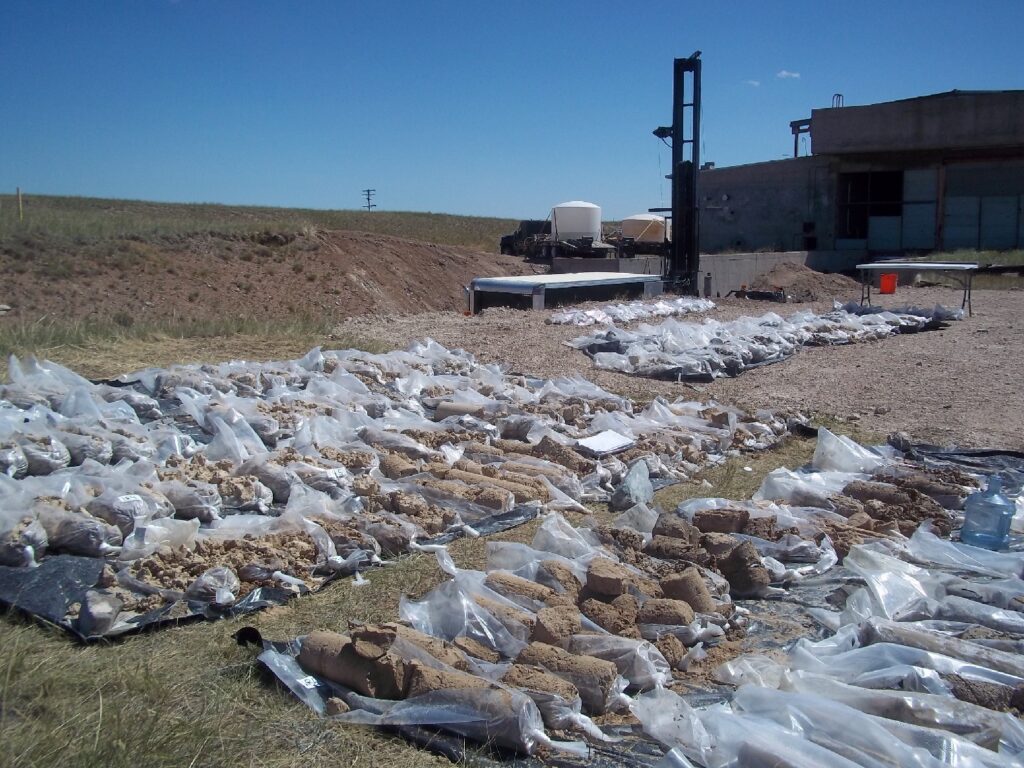
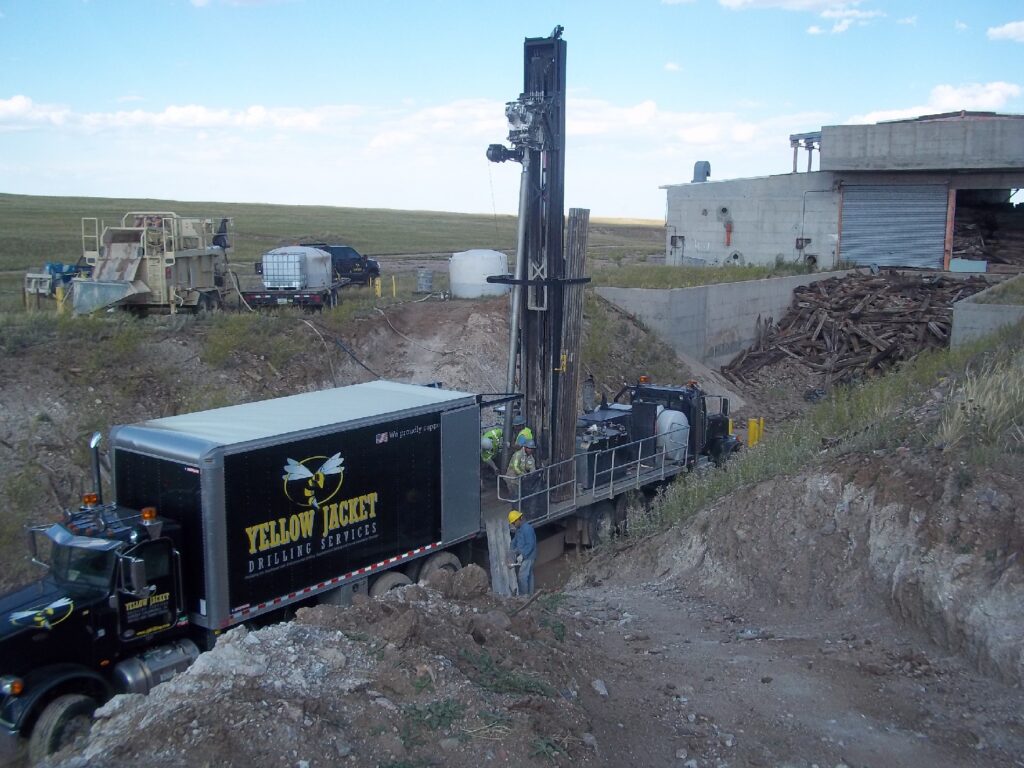
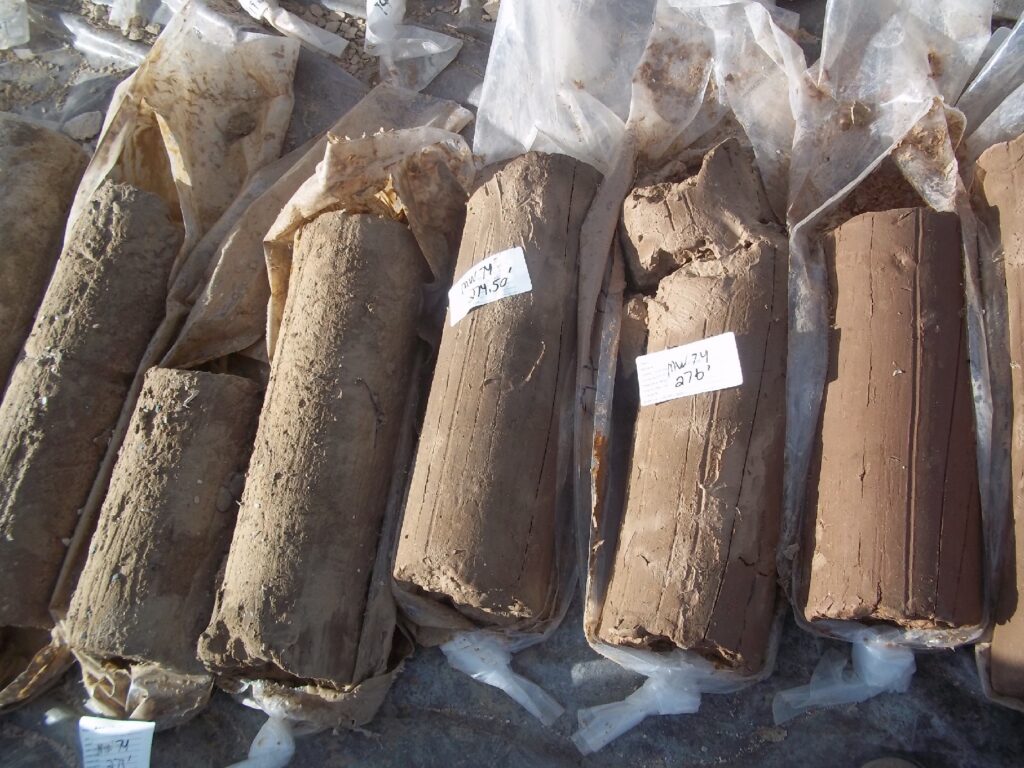
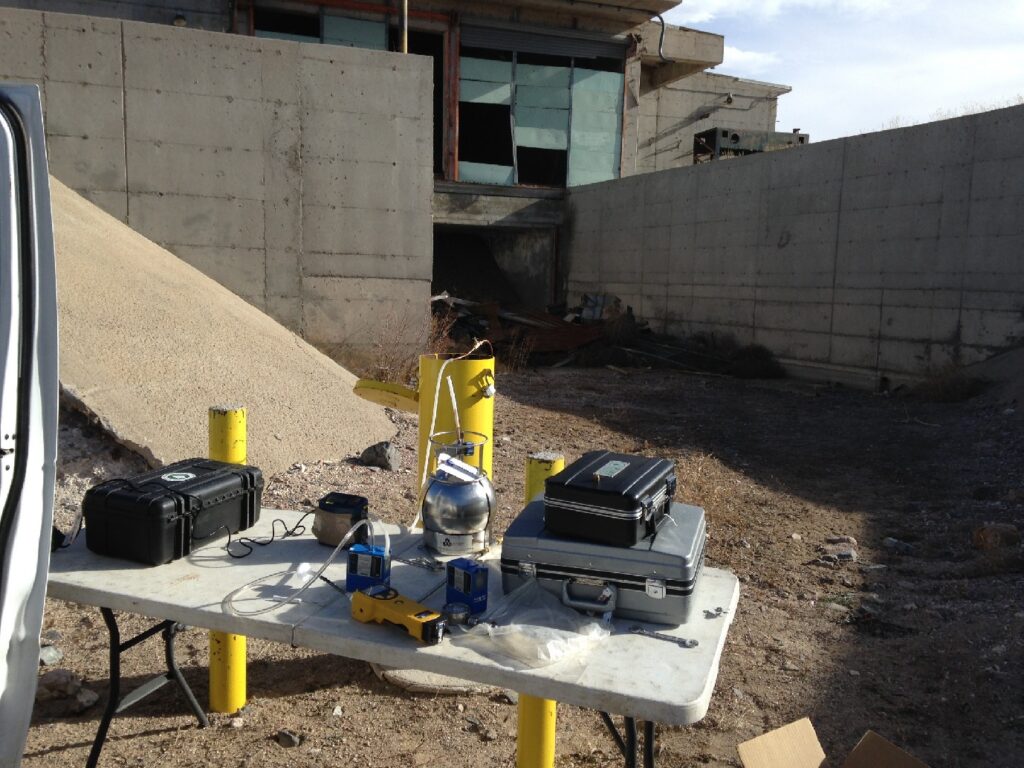
The RI drilling and sampling program at Area A was extensive, involving 7-inch diameter continuous soil and rock cores at each location with samples for laboratory analysis collected every two feet below the water table. Soil samples were collected every two feet from continuously cored borings, from the ground surface to depths of 250 feet bgs, in the LSB area and immediately downgradient locations during 2016 and 2017. An onsite laboratory provided near-real-time VOC results, allowing detailed vertical contaminant profiles to be developed. These profiles, combined with drilling log and borehole hydro-physical log data, were used to select the appropriate screened intervals for the nested monitoring wells installed at each location. In general, the upper two screens at each location were installed within the zones of highest contamination and/or groundwater flow, and the lowermost screen was positioned below the zone of contamination.
The flame pits of LSB 1 and LSB 2 in Area A are the primary source areas of TCE in soil, with the highest concentrations detected in soil samples collected at flame pit drilling/monitoring well locations MW59 and MW60, respectively, within the saturated clay/silt soil matrix extending approximately 80-100 feet below the water table. TCE in soil in the vadose zone at Area A is limited, with virtually all detections occurring in soil samples collected from below the water table, even at flame pit locations. The vertical extent of observed soil contamination is limited to the WRF, and all locations in Area A exhibiting subsurface soil contamination are within the currently defined extent of the TCE groundwater plume.
The MW59 and MW60 nested wells were added to the Long-Term Monitoring schedule in Fall 2016 with groundwater samples collected and analyzed over the following seven years (15 LTM sample events). TCE concentrations in the shallow groundwater samples collected from MW59-74 (screened approximately 20 feet below the water table) have been consistently between 160,000 and 190,000 µg/L, while samples from the middle well MW59-125 (screened just above the hard claystone layer) have shown a trend of steadily decreasing concentrations, from 28,000 µg/L in the Fall 2016 event to just 680 µg/L in the Fall 2023 event.
The highest concentrations of TCE observed in Area A have been at these two monitoring well locations, indicating that the flame pits adjacent to LSB 1 and LSB 2 are the primary source areas of TCE in groundwater, with concentrations that substantially exceed the USEPA Maximum Contaminant Level (MCL) of 5 μg/L. At LSB 1, TCE concentrations in the shallow groundwater samples collected from MW59-74 (screened approximately 20 feet below the water table) have been consistently between 160,000 and 190,000 μg/L, with lower and generally declining concentrations at deeper intervals. At LSB 2, TCE concentrations in the shallow groundwater samples collected from MW60-90 (screened approximately 27 feet below the water table) have been consistently between 19,000 and 29,000 μg/L. Sample results for the middle well MW60-146 (screened near the top of the thick claystone layer) have shown a trend of steady concentrations around 2,000 μg/L during the Fall 2016-Spring 2020 events, and a fluctuating but generally increasing trend from Fall 2020 to Fall 2023, apparently in response to the injection pilot test (zero-valent iron injections) conducted at LSB 2 in the summer of 2020. TCE concentrations in samples from MW60-146 had increased to 15,000 μg/L by the Fall 2021 event and to 24,000 μg/L in the Fall 2023 event.
The borehole advanced in the flame pit at LSB 3 indicated that only slight traces of TCE contamination were detected in soil samples between 77 and 91 feet bgs, and only trace levels, below the MCL, have been detected in groundwater samples from the two monitoring wells installed at this location. In contrast, TCE is present at elevated concentrations (350 to 770 μg/L) in the WRF at MW101, located approximately 1,200 feet east of LSB 3, suggesting that any contamination that may have been present in the upper WRF beneath LSB 3 has largely migrated away from the building, likely along a sand layer within the uppermost Brule sediments approximately 92–102 ft bgs as logged at MW64.
Injection Pilot Tests were conducted at LSB 1 and LSB 2 in 2020 in support of the Feasibility Study for Atlas Site 4. An in situ chemical oxidation (ISCO) pilot test was implemented at LSB 1 using potassium permanganate (KMnO4) injected into the contamination zone hot spot around MW59 in three boreholes. At LSB 2, an in situ chemical reduction (ISCR) pilot test was performed using zero-valent iron (ZVI) injected into the contamination zone around MW60 in three boreholes and immediately downgradient of the LSB in another three boreholes.
In addition to the RI wells, another two nested monitoring wells were installed in Area A in 2020-21 as part of a Data Gaps Investigation (DGI). The RI and DGI wells are located immediately downgradient of LSBs 1 and 2, in the areas between the three LSBs, and at several locations to the north, northeast, and east of the LSB area. Long-term monitoring of the groundwater at Area A from 2016 to 2023 has identified a stable TCE plume that is mostly present in the upper WRF (Brule) fine-grained material. A few intervals of preferential flow, associated with sparse sandy intervals that likely reflect narrow paleo-channels, have been observed at some of these well locations. Groundwater flow is to the east and northeast from the LSBs, with most of the TCE plume present within the Brule deposits; only a few feet of the overlying Ogallala alluvial fan deposits are saturated, generally in the area northeast and east of LSBs 2 and 3. TCE concentrations in groundwater in the area just to the northeast and east (within approximately 900 feet) of the LSB area have been measured consistently in samples between 350 and 5,900 μg/L, with the plume vertical thickness at approximately 120 feet. Figure 3 (link to pdf) below illustrates the TCE plume in Area A and the adjacent western part of the Transition Area, with groundwater sample TCE results shown for selected well locations.
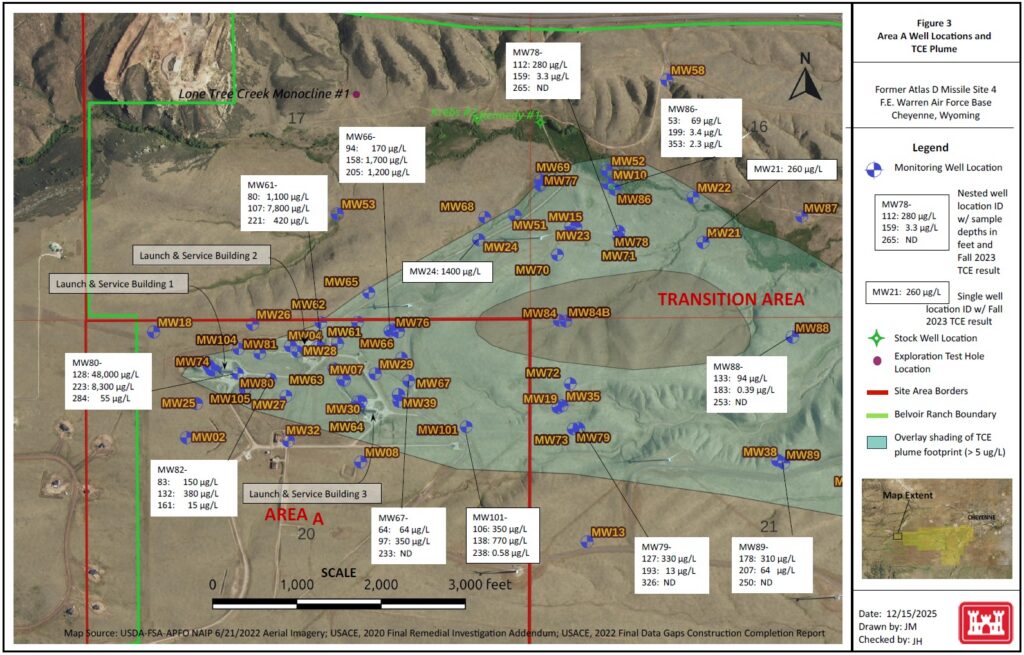
The TCE plume migrates from Area A at the northeast corner via two pathways, one along a northeast vector towards Lone Tree Creek and the other along an eastward vector. These vectors are coincident with two paleo-channels on the upper surface of the WRF, which allow preferential flow within the few feet of saturated Ogallala material (gravelly silt and sand) and likely, to some degree, have introduced TCE-contaminated groundwater to the upper WRF immediately downgradient from Area A by downward percolation along the base of the two paleo-channels. Aquifer testing of the saturated Brule at these well locations has generally shown that the hydraulic conductivity is too low to have allowed the TCE to migrate solely through the claystones and mudstones to the depths at which it is present within the time since the releases (approximately 1960-1962), except along sparse buried channels, which are mostly quite thin and were not observed to any great degree in the soil cores, except for the 12-ft thick sand layer close to the upper surface of the unit at MW64 and MW63. Deeper preferential flow zones were only observed in a few instances and were usually less than two feet thick.
Webpage updated 6/24/2026